Fan Migration Trends Between Concurrent League Seasons Driven by Social Platform Virality Metrics and Cross-Promotional Partnerships
Written by Jordan Lang · Jun 24, 2026
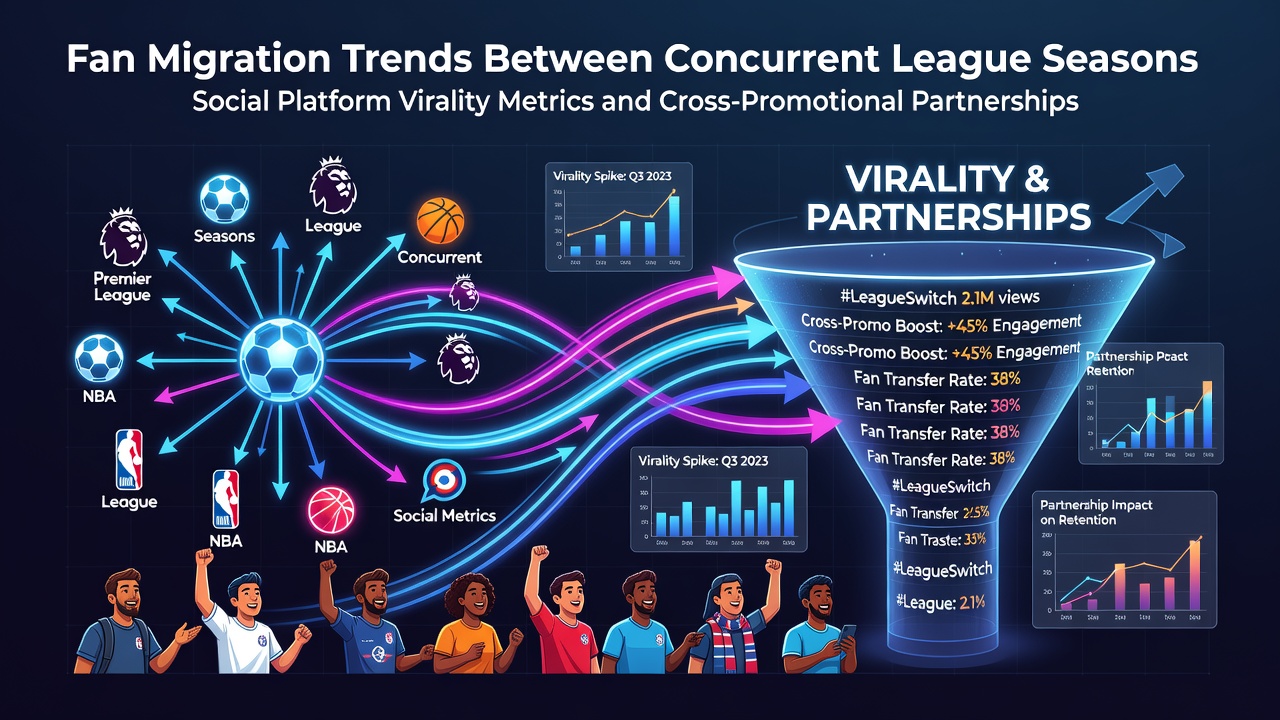
Fan Migration Trends Between Concurrent League Seasons Driven by Social Platform Virality Metrics and Cross-Promotional Partnerships
Data from multiple tracking services shows fans shifting attention between overlapping league schedules when short-form clips gain rapid traction on platforms like TikTok and Instagram, while cross-promotional deals between organizations accelerate those movements by bundling highlights and exclusive drops.
Researchers at several universities have documented these patterns through engagement analytics, noting that a single clip exceeding several million views often correlates with measurable increases in searches for the featured league's fixtures even when another season runs simultaneously.
Virality Metrics Shaping Attention Shifts
Platform algorithms reward content that achieves high completion rates and shares within the first hour of posting, which creates feedback loops where fans discover new leagues through algorithmic recommendations rather than traditional broadcasts. Observers tracking these metrics have recorded spikes in follower growth for secondary leagues during periods when primary league content saturates feeds, particularly when partnerships supply ready-made assets for creators to remix.
Figures released by media research firms indicate that leagues providing API access to highlight packages see faster uptake on social channels, and those integrations frequently coincide with temporary dips in engagement for competing fixtures running at the same time. One study released in early 2025 tracked migration during spring overlaps between European football and North American basketball, revealing that virality thresholds above 500,000 shares within 24 hours preceded measurable upticks in app downloads for the promoted league.
Cross-Promotional Partnerships as Catalysts
Joint marketing agreements between leagues and streaming services supply creators with co-branded templates and early access to footage, which lowers the barrier for producing shareable material that pulls audiences across schedules. Partnerships announced ahead of the 2025-2026 cycles included provisions for synchronized drop times, allowing a basketball playoff highlight to appear alongside a soccer cup final teaser in the same feed.
Those who've examined partnership outcomes note that leagues participating in multi-platform campaigns retain higher percentages of newly acquired followers once the overlapping window closes. In June 2026, several such agreements are scheduled for renewal, with preliminary announcements indicating expanded data-sharing clauses that could further refine targeting of users already following concurrent seasons.
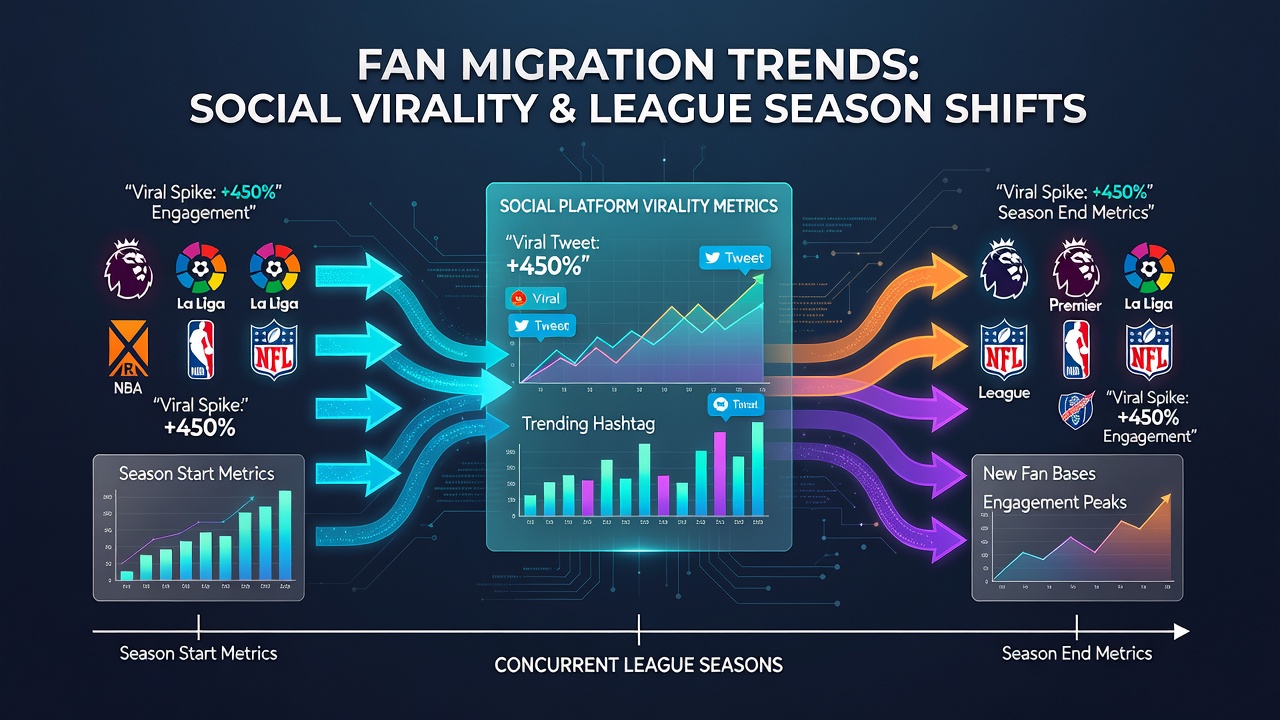
Regional Patterns and Platform Differences
Geographic variations appear in how virality translates to migration, with audiences in Asia-Pacific regions responding more readily to basketball-related clips during football-heavy periods while European users show the reverse pattern when soccer content circulates widely. Reports compiled by the Australian Sports Commission highlight that cross-promotional bundles featuring both codes generate stronger retention when local influencers participate in the campaign rollout.
North American platforms tend to favor longer highlight sequences, whereas shorter markets prioritize 15-second loops that emphasize individual plays; these format preferences influence which league captures attention when schedules collide. Data shared through industry consortiums suggests that partnerships incorporating regional customization achieve higher completion rates and therefore more sustained follower transfers.
Measurement Challenges and Emerging Tools
Attributing exact migration volumes remains difficult because many viewers maintain multiple league subscriptions without fully abandoning one for another, yet session-length analytics and search-volume correlations provide proxies that researchers continue to refine. Newer dashboard tools now aggregate cross-platform signals to estimate the portion of traffic moving between concurrent calendars after a viral event.
Organizations monitoring these flows have begun publishing quarterly summaries that separate organic virality effects from those amplified by paid partnerships, allowing clearer comparison across seasons. Such distinctions help clarify whether a league's growth stems from algorithmic amplification alone or from coordinated promotional activity.
Conclusion
Patterns emerging from available analytics point to an increasingly interconnected landscape where social platform performance and partnership structures jointly determine how audiences allocate time across overlapping league calendars. Continued refinement of measurement methods should yield more precise mapping of these movements in subsequent cycles.